/!\ Attention /!\ : Ce post comporte des oneliner de plusieurs milliers de caractères qui pourraient heurter la sensibilité des jeunes scripteurs.
Ceux qui, comme nous, espéraient la voir arriver avec vSphere 5 ont été déçu. L’alarme de latence de datastore n’existe pas encore, pas en GUI du moins. Et pour cause, les compteurs de latence ne sont disponibles qu’au travers des objets VirtualMachine ou HostSystem (et HostSystem uniquement pour les compteurs SIOC). Nous vous avions proposé une solution de contournement, en PowerCLI évidement, grâce au compteur maxTotalLatency mais il restait encore à trouver quel datastore avait déclenché l’alarme.
Aujourd’hui nous vous proposons une série de oneliner qui vont créer (si elles n’existent pas déjà, ce qui veut dire que vous pouvez les utiliser en tache planifiée) des alarmes pour chaque datastore (instance = UUID) qui se déclencheront si les seuils de latence fixés sont atteint sur un ESX. Attention ça pique.
Alarme de latence Read ou Write pour datastore partagé NFS, yellow 300ms/5min et red 500ms/3min (mailto:admin@vmware.local) :
foreach ($dsname in (Get-View -ViewType datastore|?{$_.summary.Accessible -and $_.summary.MultipleHostAccess -and $_.info.nas})){if (!((Get-View AlarmManager).GetAlarm((Get-Folder -NoRecursion |Get-View).moref)|?{(get-view $_).info.name -match "$($dsname.name) datastore RW latency"})){(Get-View AlarmManager).CreateAlarm((Get-Folder -NoRecursion |Get-View).MoRef,(New-Object VMware.Vim.AlarmSpec -Property @{Name = "$($dsname.name) datastore RW latency";Description = "Custom alarm to monitor NFS $($dsname.name) ($($dsname|%{$_.Host}|%{$_.MountInfo.Path.split("/")[-1]}|sort -unique)) read or write latency";Enabled = $true;expression = (New-Object VMware.Vim.OrAlarmExpression -Property @{expression = @((New-Object VMware.Vim.MetricAlarmExpression -Property @{Metric = (New-Object VMware.Vim.PerfMetricId -Property @{CounterId = ((Get-View (Get-View ServiceINstance).Content.PerfManager).PerfCounter|?{$_.groupinfo.key -match "datastore"}|?{$_.nameinfo.key -match "totalReadLatency"}|?{$_.RollupType -match "average"}).key;Instance = ($dsname|%{$_.Host}|%{$_.MountInfo.Path.split("/")[-1]}|sort -unique)});Operator = "isAbove";Yellow = "300";YellowInterval = "300";Red = "500";RedInterval = "180";Type = "HostSystem"});(New-Object VMware.Vim.MetricAlarmExpression -Property @{Metric = (New-Object VMware.Vim.PerfMetricId -Property @{CounterId = ((Get-View (Get-View ServiceINstance).Content.PerfManager).PerfCounter|?{$_.groupinfo.key -match "datastore"}|?{$_.nameinfo.key -match "totalWriteLatency"}|?{$_.RollupType -match "average"}).key;Instance = ($dsname|%{$_.Host}|%{$_.MountInfo.Path.split("/")[-1]}|sort -unique)});Operator = "isAbove";Yellow = "300";YellowInterval = "300";Red = "500";RedInterval = "180";Type = "HostSystem"}))});Action=(New-Object VMware.Vim.GroupAlarmAction -Property @{Action= (New-Object VMware.Vim.AlarmTriggeringAction -Property @{Action = (New-Object VMware.Vim.SendEmailAction -Property @{ToList = "admin@vmware.local";Subject = "$($dsname.name) RW latency";CcList = "";Body = ""});TransitionSpecs = @((New-Object VMware.Vim.AlarmTriggeringActionTransitionSpec -Property @{StartState = "green";FinalState = "yellow";Repeats = $false});(New-Object VMware.Vim.AlarmTriggeringActionTransitionSpec -Property @{StartState = "yellow";FinalState = "red";Repeats = $false}))})});ActionFrequency = "1800"}))}}

Alarme de latence Read ou Write pour datastore partagé VMFS, yellow 30ms/5min et red 40ms/3min (mailto:admin@vmware.local) :
foreach ($dsname in (Get-View -ViewType datastore|?{$_.summary.Accessible -and $_.summary.MultipleHostAccess -and $_.info.vmfs})){if (!((Get-View AlarmManager).GetAlarm((Get-Folder -NoRecursion |Get-View).moref)|?{(get-view $_).info.name -match "$($dsname.name) datastore RW latency"})){(Get-View AlarmManager).CreateAlarm((Get-Folder -NoRecursion |Get-View).MoRef,(New-Object VMware.Vim.AlarmSpec -Property @{Name = "$($dsname.name) datastore RW latency";Description = "Custom alarm to monitor VMFS $($dsname.name) ($($dsname|%{$_.Host}|%{$_.MountInfo.Path.split("/")[-1]}|sort -unique)) read or write latency";Enabled = $true;expression = (New-Object VMware.Vim.OrAlarmExpression -Property @{expression = @((New-Object VMware.Vim.MetricAlarmExpression -Property @{Metric = (New-Object VMware.Vim.PerfMetricId -Property @{CounterId = ((Get-View (Get-View ServiceINstance).Content.PerfManager).PerfCounter|?{$_.groupinfo.key -match "datastore"}|?{$_.nameinfo.key -match "totalReadLatency"}|?{$_.RollupType -match "average"}).key;Instance = ($dsname|%{$_.Host}|%{$_.MountInfo.Path.split("/")[-1]}|sort -unique)});Operator = "isAbove";Yellow = "30";YellowInterval = "300";Red = "40";RedInterval = "180";Type = "HostSystem"});(New-Object VMware.Vim.MetricAlarmExpression -Property @{Metric = (New-Object VMware.Vim.PerfMetricId -Property @{CounterId = ((Get-View (Get-View ServiceINstance).Content.PerfManager).PerfCounter|?{$_.groupinfo.key -match "datastore"}|?{$_.nameinfo.key -match "totalWriteLatency"}|?{$_.RollupType -match "average"}).key;Instance = ($dsname|%{$_.Host}|%{$_.MountInfo.Path.split("/")[-1]}|sort -unique)});Operator = "isAbove";Yellow = "30";YellowInterval = "300";Red = "40";RedInterval = "180";Type = "HostSystem"}))});Action=(New-Object VMware.Vim.GroupAlarmAction -Property @{Action= (New-Object VMware.Vim.AlarmTriggeringAction -Property @{Action = (New-Object VMware.Vim.SendEmailAction -Property @{ToList = "admin@vmware.local";Subject = "$($dsname.name) RW latency";CcList = "";Body = ""});TransitionSpecs = @((New-Object VMware.Vim.AlarmTriggeringActionTransitionSpec -Property @{StartState = "green";FinalState = "yellow";Repeats = $false});(New-Object VMware.Vim.AlarmTriggeringActionTransitionSpec -Property @{StartState = "yellow";FinalState = "red";Repeats = $false}))})});ActionFrequency = "1800"}))}}
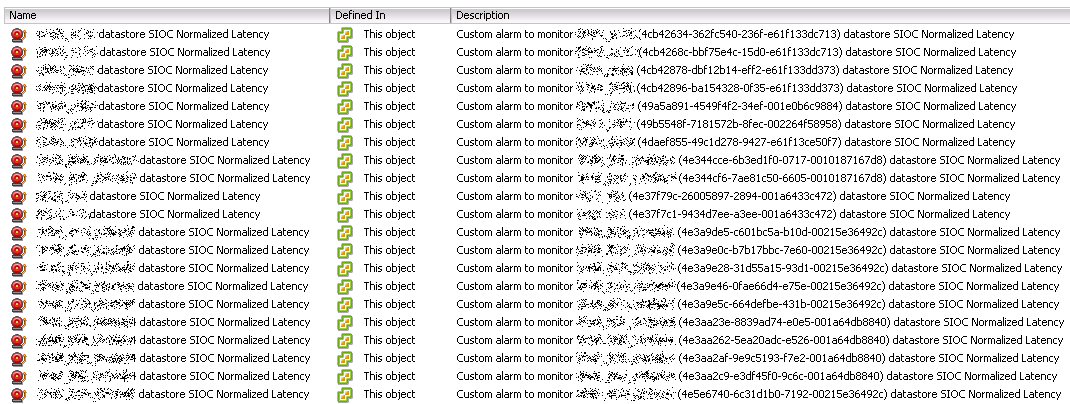
Alarme de latence SIOC Normalized Latency pour datastore partagé, yellow 30ms/5min et red 40ms/3min (mailto:admin@vmware.local) :
foreach ($dsname in (Get-View -ViewType datastore|?{$_.summary.Accessible -and $_.summary.MultipleHostAccess -and $_.IormConfiguration.Enabled})){if (!((Get-View AlarmManager).GetAlarm((Get-Folder -NoRecursion |Get-View).moref)|?{(get-view $_).info.name -match "$($dsname.name) datastore SIOC Normalized Latency"})){(Get-View AlarmManager).CreateAlarm((Get-Folder -NoRecursion |Get-View).MoRef,(New-Object VMware.Vim.AlarmSpec -Property @{Name = "$($dsname.name) datastore SIOC Normalized Latency";Description = "Custom alarm to monitor $($dsname.name) ($($dsname|%{$_.Host}|%{$_.MountInfo.Path.split("/")[-1]}|sort -unique)) datastore SIOC Normalized Latency";Enabled = $true;expression = (New-Object VMware.Vim.OrAlarmExpression -Property @{expression = @((New-Object VMware.Vim.MetricAlarmExpression -Property @{Metric = (New-Object VMware.Vim.PerfMetricId -Property @{CounterId = ((Get-View (Get-View ServiceINstance).Content.PerfManager).PerfCounter|?{$_.groupinfo.key -match "datastore"}|?{$_.nameinfo.key -match "sizeNormalizedDatastoreLatency"}|?{$_.RollupType -match "average"}).key;Instance = ($dsname|%{$_.Host}|%{$_.MountInfo.Path.split("/")[-1]}|sort -unique)});Operator = "isAbove";Yellow = "30000";YellowInterval = "300";Red = "40000";RedInterval = "180";Type = "HostSystem"}))});Action=(New-Object VMware.Vim.GroupAlarmAction -Property @{Action= (New-Object VMware.Vim.AlarmTriggeringAction -Property @{Action = (New-Object VMware.Vim.SendEmailAction -Property @{ToList = "admin@vmware.local";Subject = "$($dsname.name) SIOC Normalized Latency";CcList = "";Body = ""});TransitionSpecs = @((New-Object VMware.Vim.AlarmTriggeringActionTransitionSpec -Property @{StartState = "green";FinalState = "yellow";Repeats = $false});(New-Object VMware.Vim.AlarmTriggeringActionTransitionSpec -Property @{StartState = "yellow";FinalState = "red";Repeats = $false}))})});ActionFrequency = "1800"}))}}
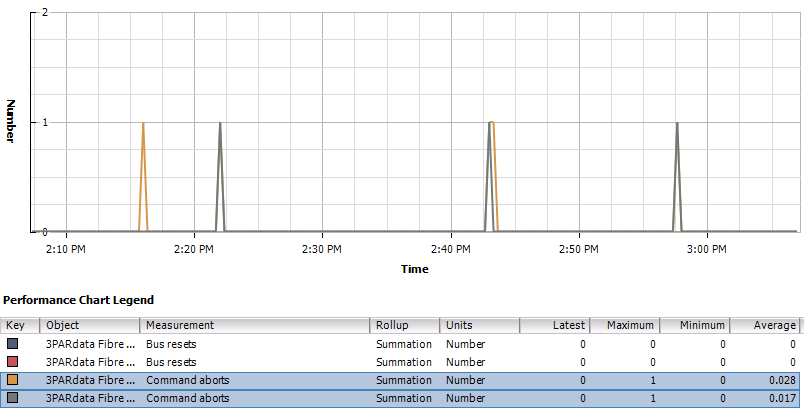
Bonus : Alarme de Disk Command aborts pour datastore VMFS partagé, en cas de défaillance/saturation DAS/SAN/iSCSI (mailto:admin@vmware.local) :
foreach ($diskname in (Get-View -ViewType datastore|?{$_.info.vmfs -and $_.summary.Accessible -and $_.summary.MultipleHostAccess}|%{$_.info.vmfs.extent}|%{$_.diskname})){if (!((Get-View AlarmManager).GetAlarm((Get-Folder -NoRecursion |Get-View).moref)|?{(get-view $_).info.name -match "$diskname Disk Command aborts"})){(Get-View AlarmManager).CreateAlarm((Get-Folder -NoRecursion |Get-View).MoRef,(New-Object VMware.Vim.AlarmSpec -Property @{Name = "$diskname Disk Command aborts";Description = "Custom alarm to monitor $diskname Disk Command aborts";Enabled = $true;expression = (New-Object VMware.Vim.OrAlarmExpression -Property @{expression = (New-Object VMware.Vim.MetricAlarmExpression -Property @{Metric = (New-Object VMware.Vim.PerfMetricId -Property @{CounterId = ((Get-View (Get-View ServiceINstance).Content.PerfManager).PerfCounter|?{$_.groupinfo.key -match "disk"}|?{$_.nameinfo.key -match "commandsAborted"}|?{$_.GroupInfo.Key -ne "virtualDisk"}|?{$_.RollupType -match "summation"}).key;Instance = $diskname});Operator = "isAbove";Yellow = "1";Red = "2";Type = "HostSystem"})});Action=(New-Object VMware.Vim.GroupAlarmAction -Property @{Action= (New-Object VMware.Vim.AlarmTriggeringAction -Property @{Action = (New-Object VMware.Vim.SendEmailAction -Property @{ToList = "admin@vmware.local";Subject = "$diskname Disk Command aborts";CcList = "";Body = ""});TransitionSpecs = @((New-Object VMware.Vim.AlarmTriggeringActionTransitionSpec -Property @{StartState = "green";FinalState = "yellow";Repeats = $false});(New-Object VMware.Vim.AlarmTriggeringActionTransitionSpec -Property @{StartState = "yellow";FinalState = "red";Repeats = $true}))})});ActionFrequency = "1800"}))}}
Tags: monitoring, NFS, PowerCLI, powershell, SAN, SIOC, vCenter, VMFS


 Loading ...